
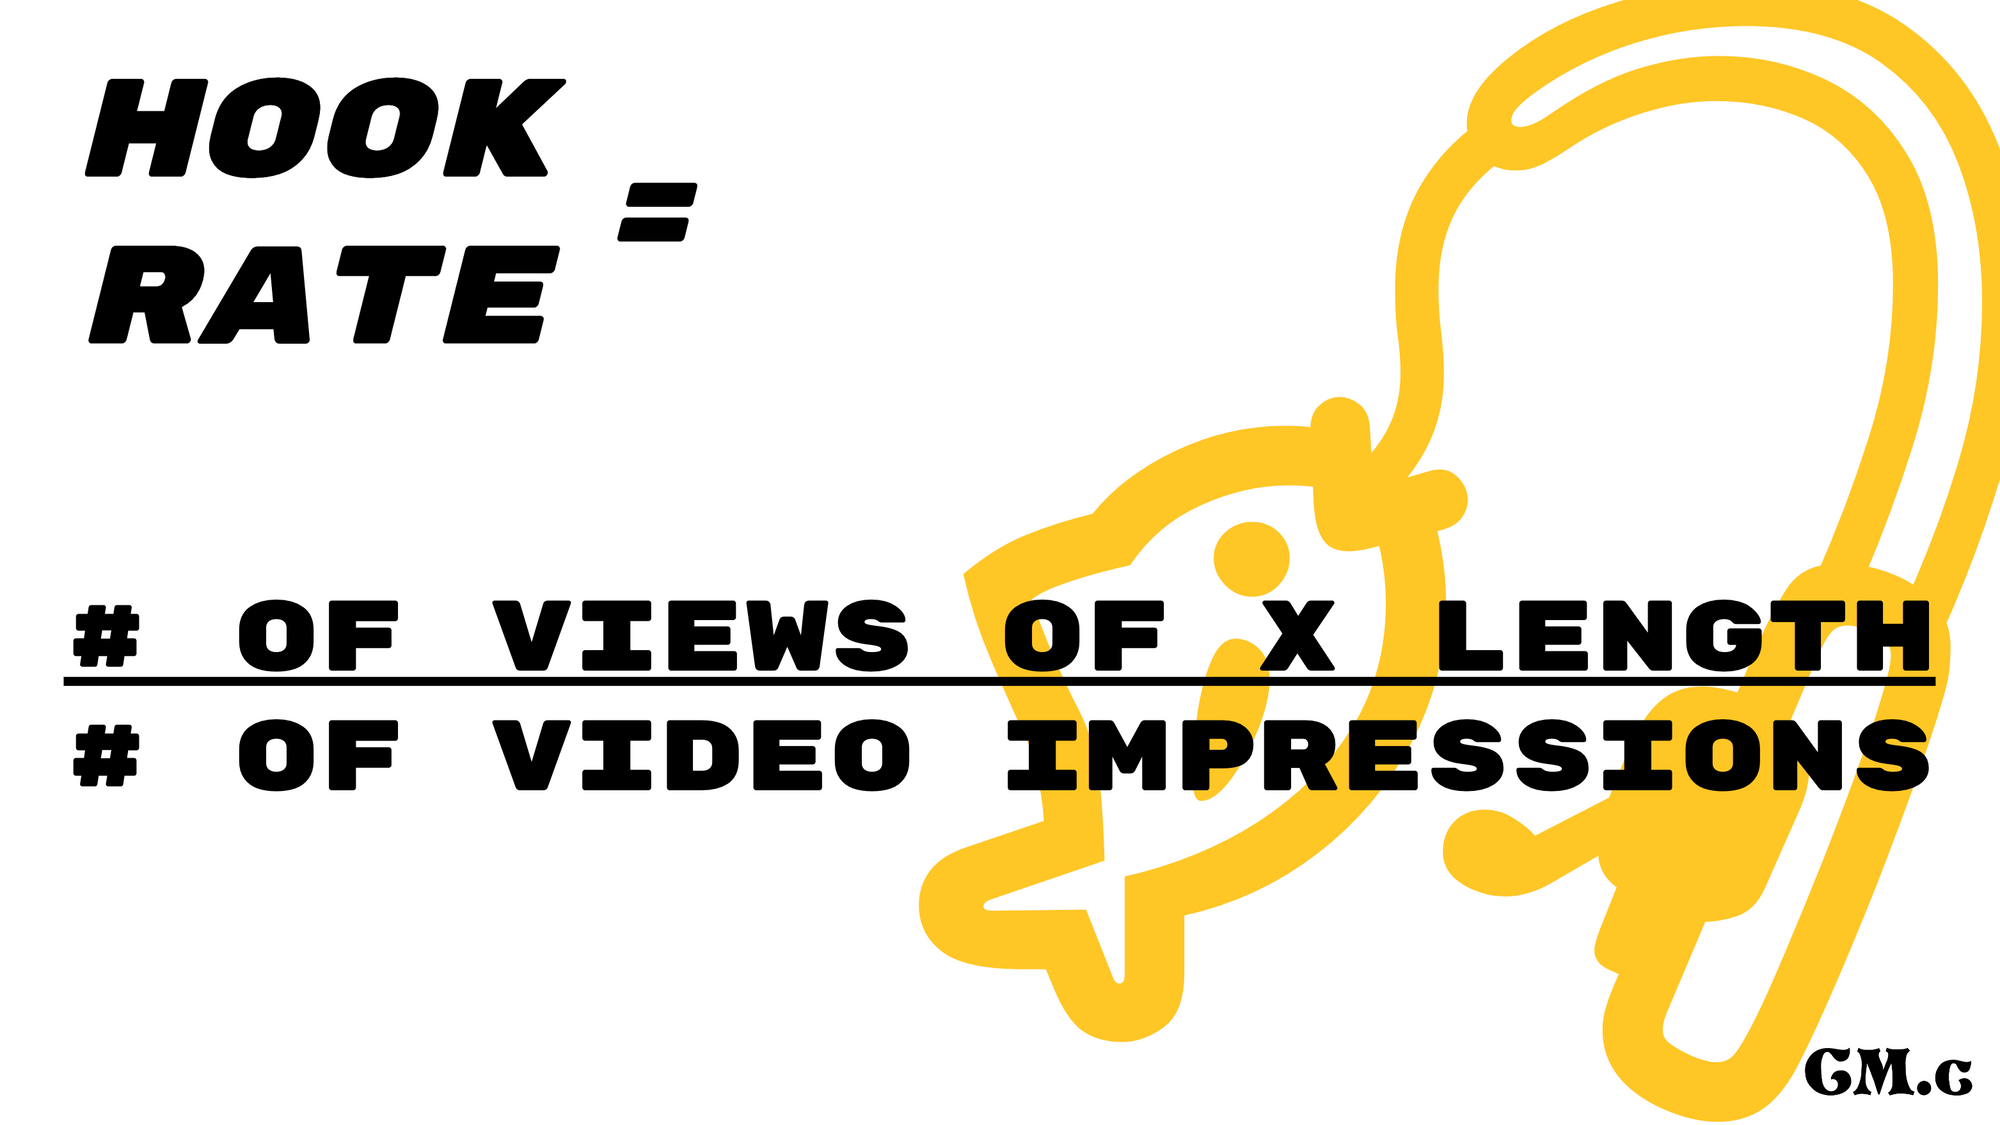
It's A Metric! Hook Rate
Are your videos thumb stopping?
Do they have the right hooks?
To find out, calculate the hook rate.
Solve for X
How do you pick a video length?
The easiest answer is that you go with what each platform gives you.
The current standard set by the Interactive Advertising Bureau is 2 seconds (I think this used to be 3 seconds), which makes it a common metric across platforms.
Meta reports on 2 second views (or at least has columns for it), 3 seconds, and ThruPlays—which are views up to 15 seconds (either entire video or 15 seconds if longer). You can optimize for 2 second views or 15 second thruplays.
TikTok reports on 2 second views and 6 second focused views. You optimize for focused views.
Pinterest reports on 2 second and 3 second video views. Bidding based on 2 second views.
LinkedIn reports on 2 second views. Or a click. Whichever comes first.
Google / YouTube counts a view as a duration up to 30 seconds depending on the length of the video. Anything shorter than 30 seconds counts a full play as a view. Clicking the video ad also counts as a view. And viewability is based on 1-2 second views depending on type. Honestly, a bit messy.
I do wish 5 second views was an easy-to-pull metric as this is the cutoff frequently cited by these platforms. Most best practices talk about what you need to include in the first 5 seconds. But they didn't ask me what should be in the reporting view, so oh well.
What's Good?
Every decision maker's favorite question and every analyst's least favorite.
The short answer: it depends!
The best approach would be to develop an internal baseline and then start keeping an eye out for outliers, good and bad.
But let’s say ~25%. Because that’s a nice round number that falls in line with this benchmark analysis.
Get Hooked Up
As with most metrics, hook rate is useless in a vacuum.
Here are a few use cases I can think of to incorporate hook rate into your strategic analytics toolbox:
- Compare hook rates across platforms to identify high performers and those that may need different creative to succeed.
- Compare videos within a platform to see what hooks viewers the most and adjust your (platform-specific) creative strategy accordingly.
- Monitor hook rate for each video over time to determine when effectiveness is waning and creative fatigue may be setting in.
- Determine if there is a correlation between hook rate and business goal performance.
- For A/B testing, of course.
To Review
Hook rate is the number of video views of a certain length divided by the number of impressions that video delivered.
As an example, a client's Meta account has a video with 6,902 3-second views so far this month on 15,970 impressions.
6,902 / 15,970 = 43% hook rate
Go forth and measure!
Syllabus:
- Benchmarking Facebook Video Ad Hook Rates
- What is a Hook Rate? (I find the written explanation of the formula sub-par in this, but it includes more platforms and context if you’re interested.)
- Google: Overview of Viewability and Active View